Buckets View
Now that you have a FHIR bucket, let’s explore the Buckets view. We’ll look at Collections, load a sample dataset, and review the FTS Indexes that power search.
- Navigate Collections and read key metrics
- Load the US Core sample dataset
- Inspect the automatically created FTS Indexes
Collections
The Buckets view opens on the Collections tab. In the top-right, there’s a selector to choose which FHIR bucket to view. If you have only one, it’s selected by default.
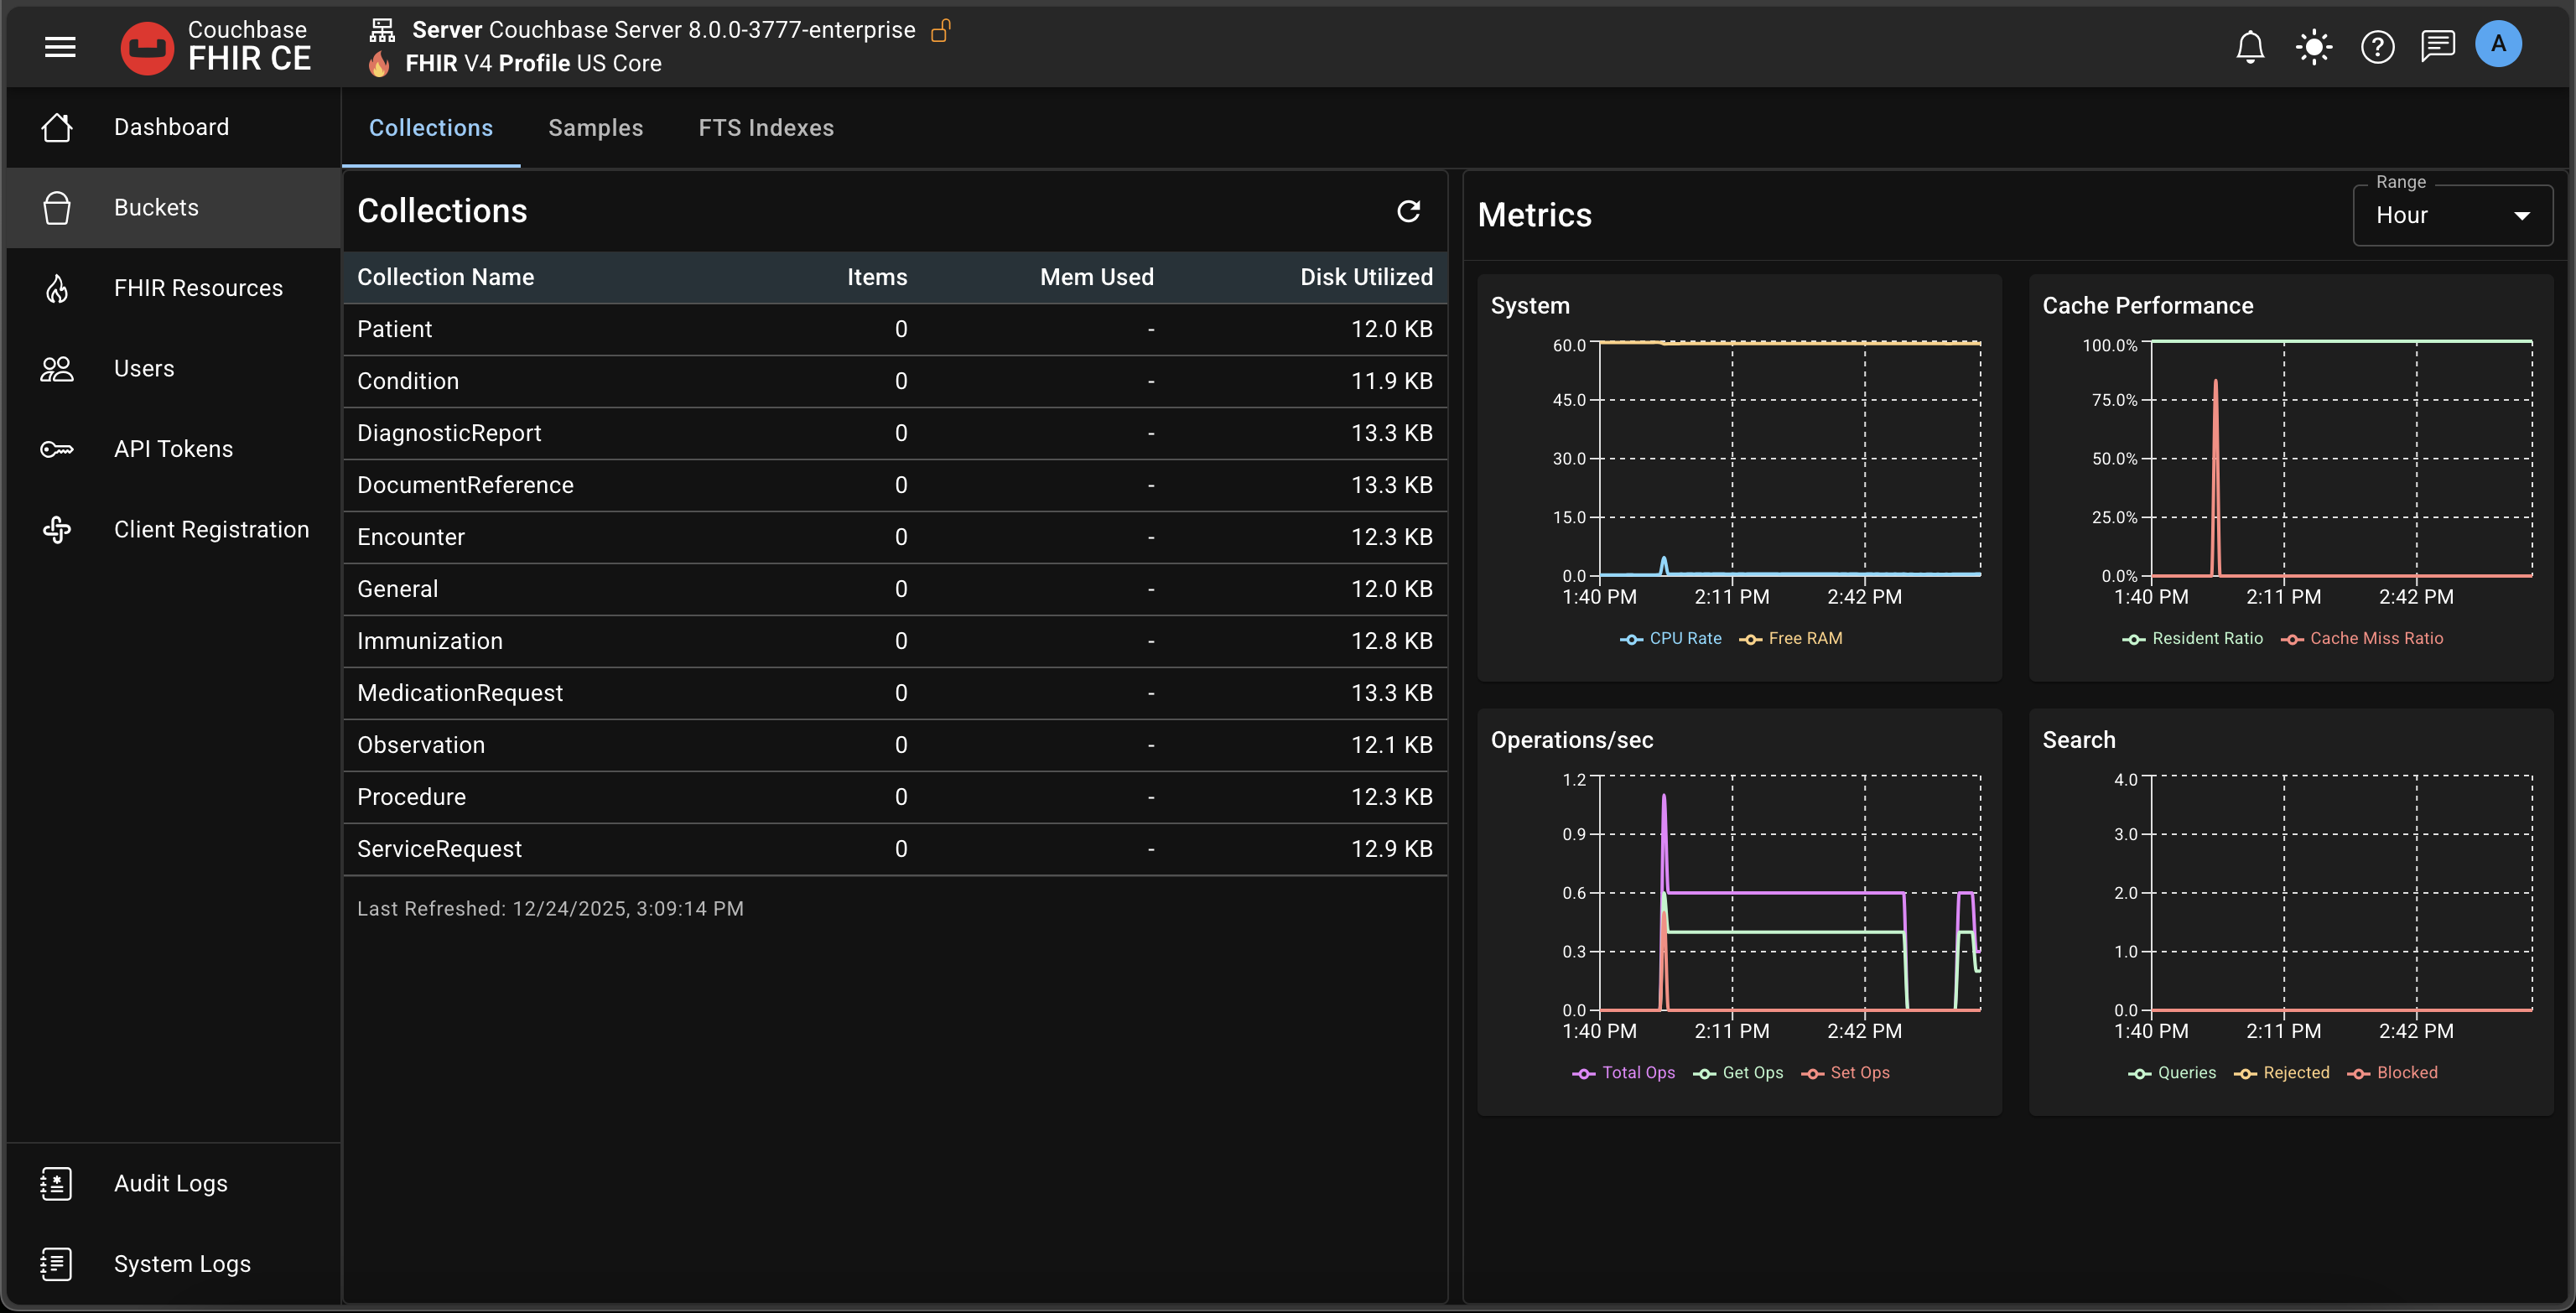
The Collections table lists all FHIR resource collections for the bucket, along with document counts.
The table doesn’t show the internal system collections (e.g., Versions and Tombstones). On a new FHIR bucket, document counts are 0.
Next to the table, the Metrics panel summarizes Couchbase Server metrics for this bucket:
- System: CPU and Free RAM
- Cache Performance: Resident Ratio and Cache Miss Ratio
- Operations/sec: Total, GETs, and SETs
- Search: Queries, Rejected, and Blocked (rates)
All of these come directly from Couchbase Server.
Samples
Open the Samples tab to load a small dataset.
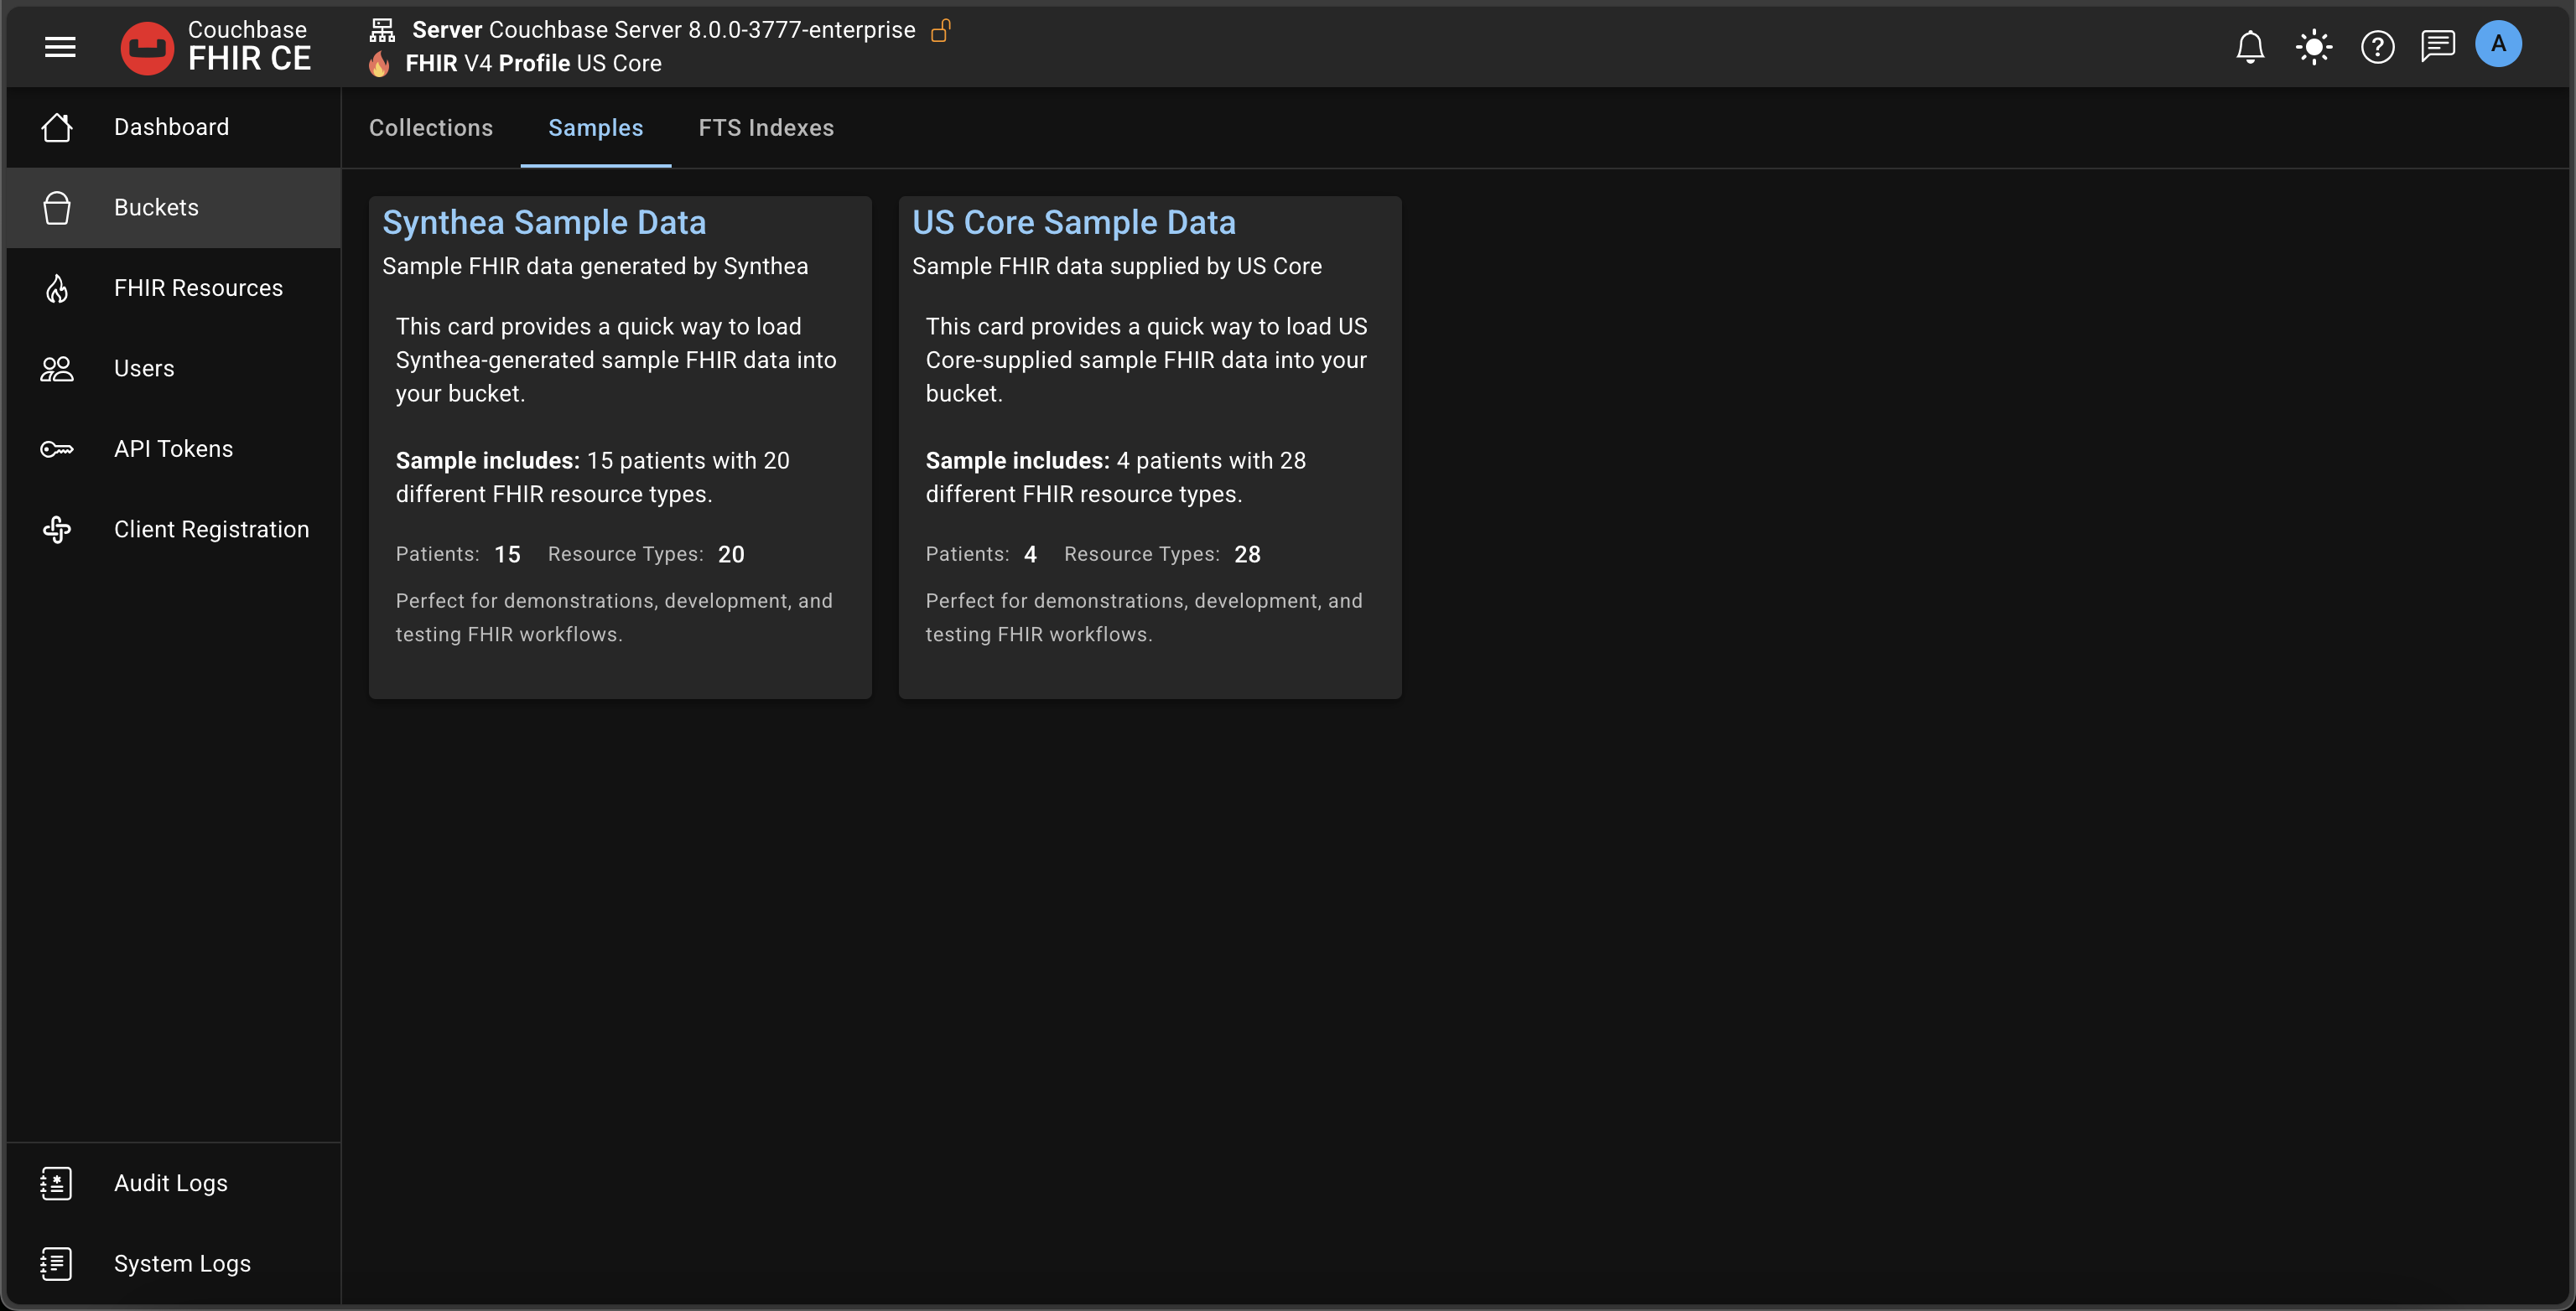
You’ll see two sample dataset cards: Synthea and US Core. Since this bucket uses the US Core profile, load the US Core sample. Data is written into the currently selected bucket.
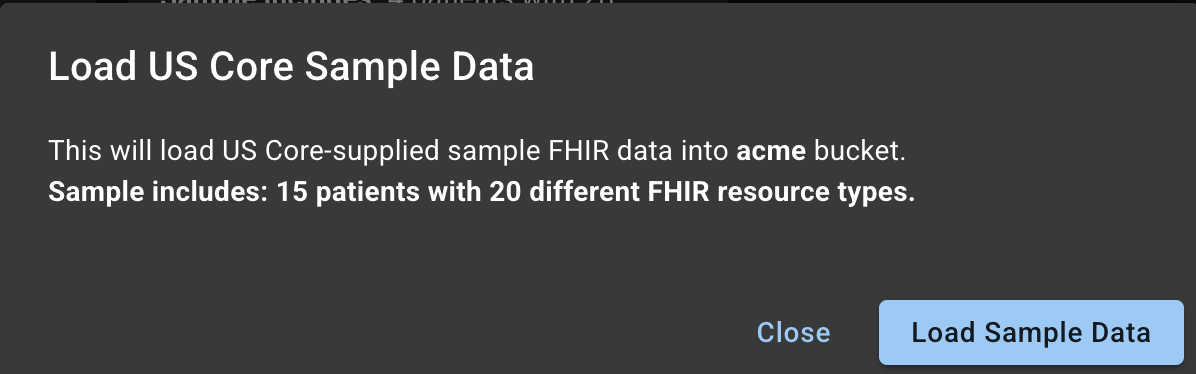
Loading takes only a few seconds. Return to the Collections tab and you’ll see document counts populated across collections.
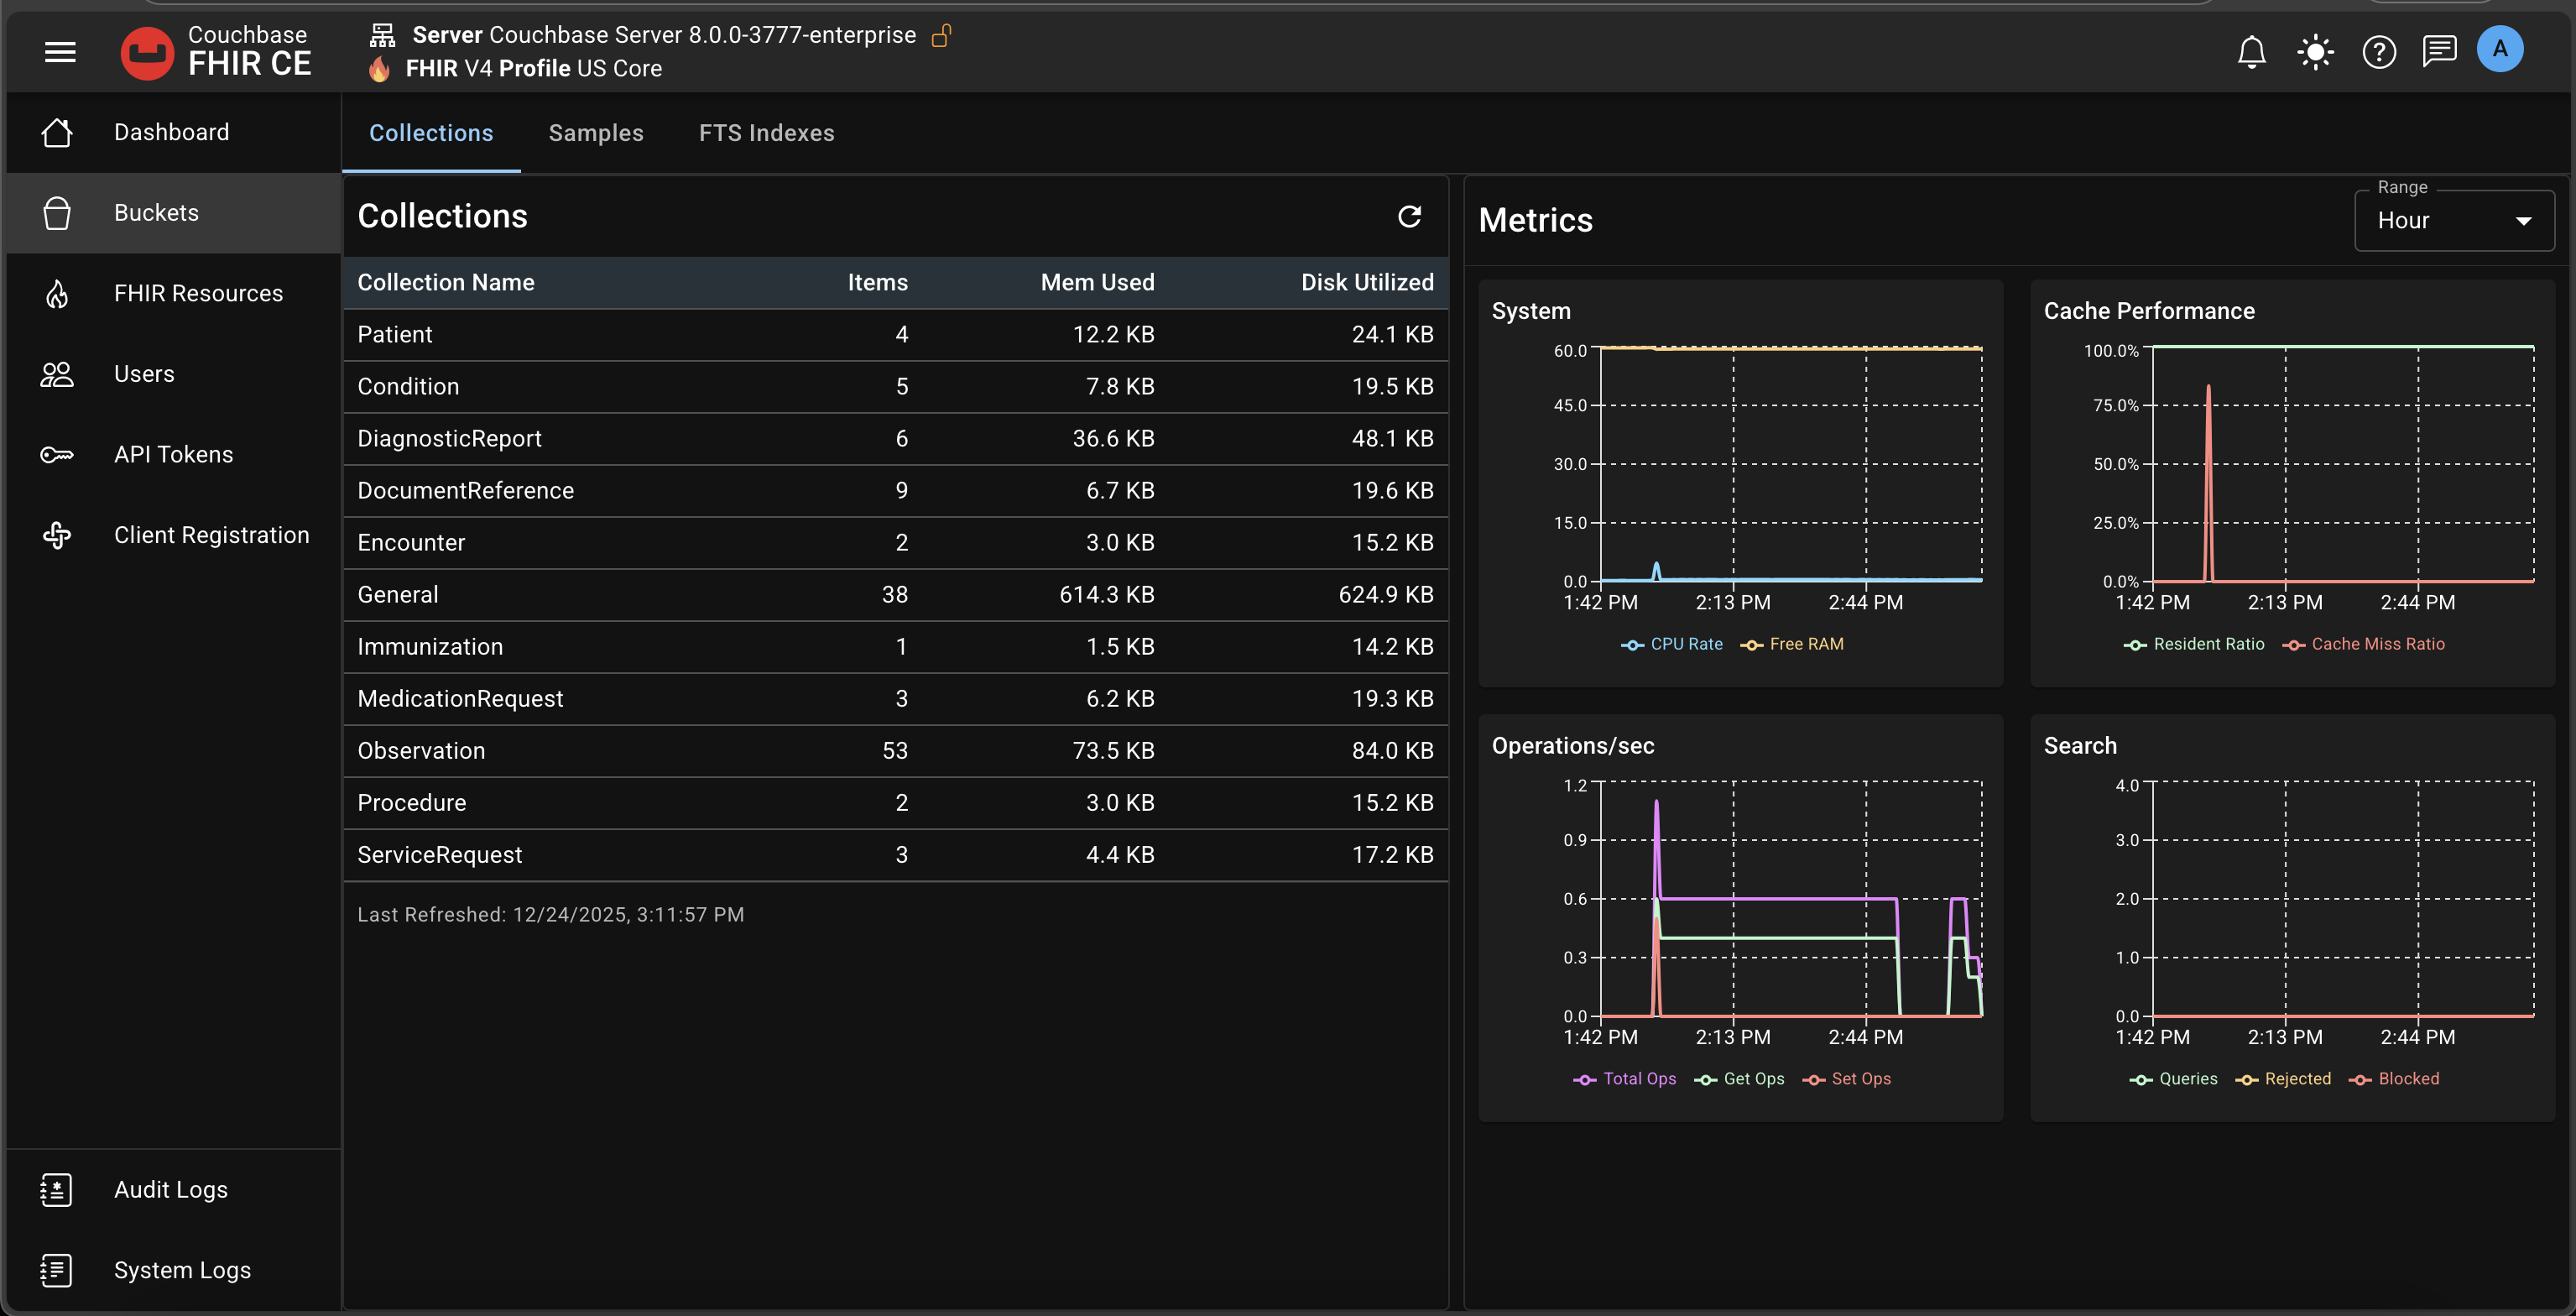
These datasets are intentionally small so you can quickly verify end-to-end behavior. For larger or custom datasets, use your own import pipelines.
FTS Indexes
Open the FTS Indexes tab to see the search indexes created for your FHIR bucket.
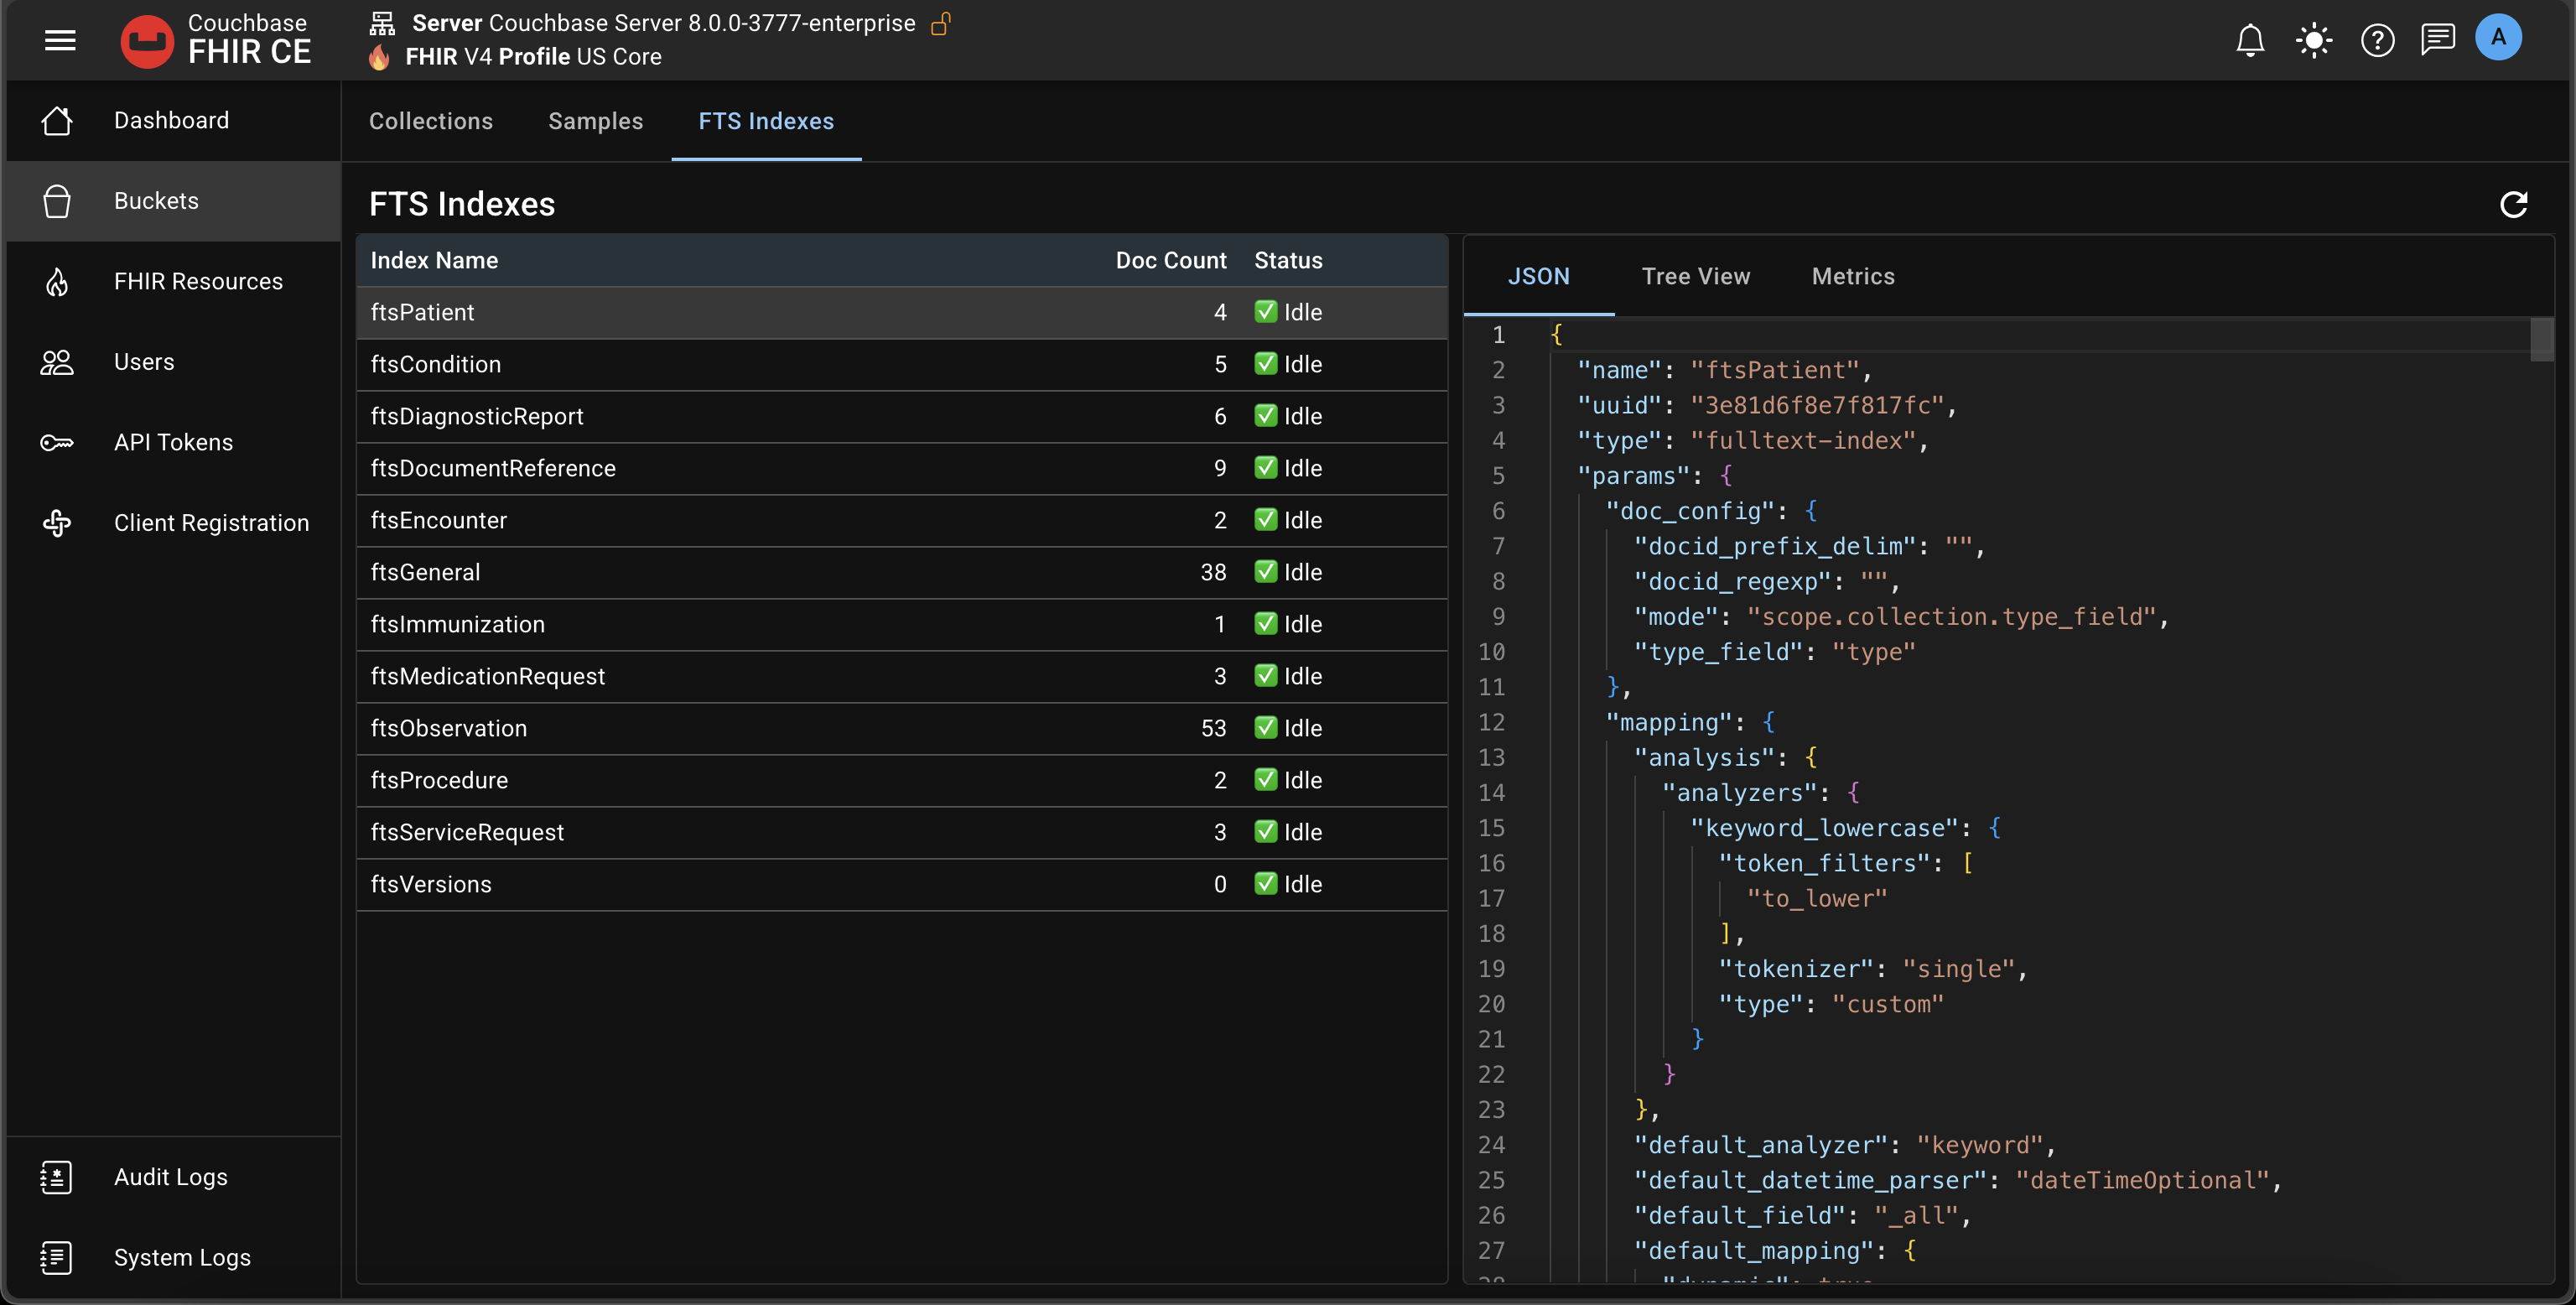
When you convert a bucket to FHIR, the system automatically creates the required FTS indexes. This view lists those indexes and shows the number of documents indexed. Selecting an index opens a details panel on the right with multiple tabs:
- JSON: the index definition in JSON
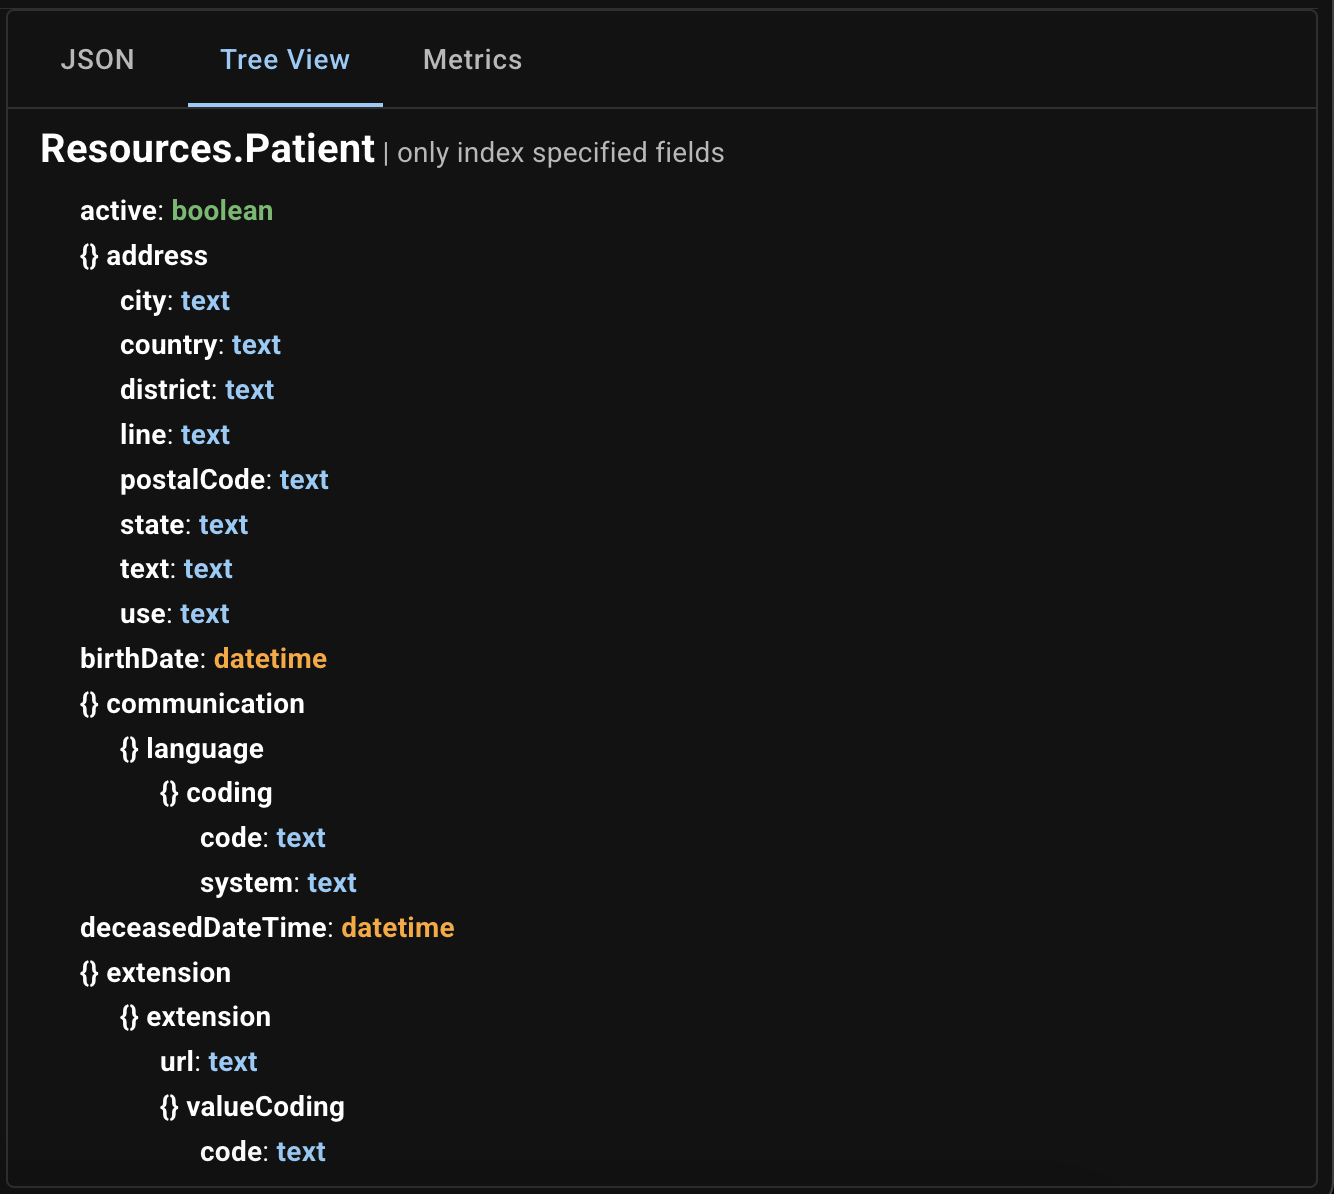
- Tree View: a hierarchical view of field mappings
- Metrics: real-time index performance and health indicators
Tree View example:
Metrics example:
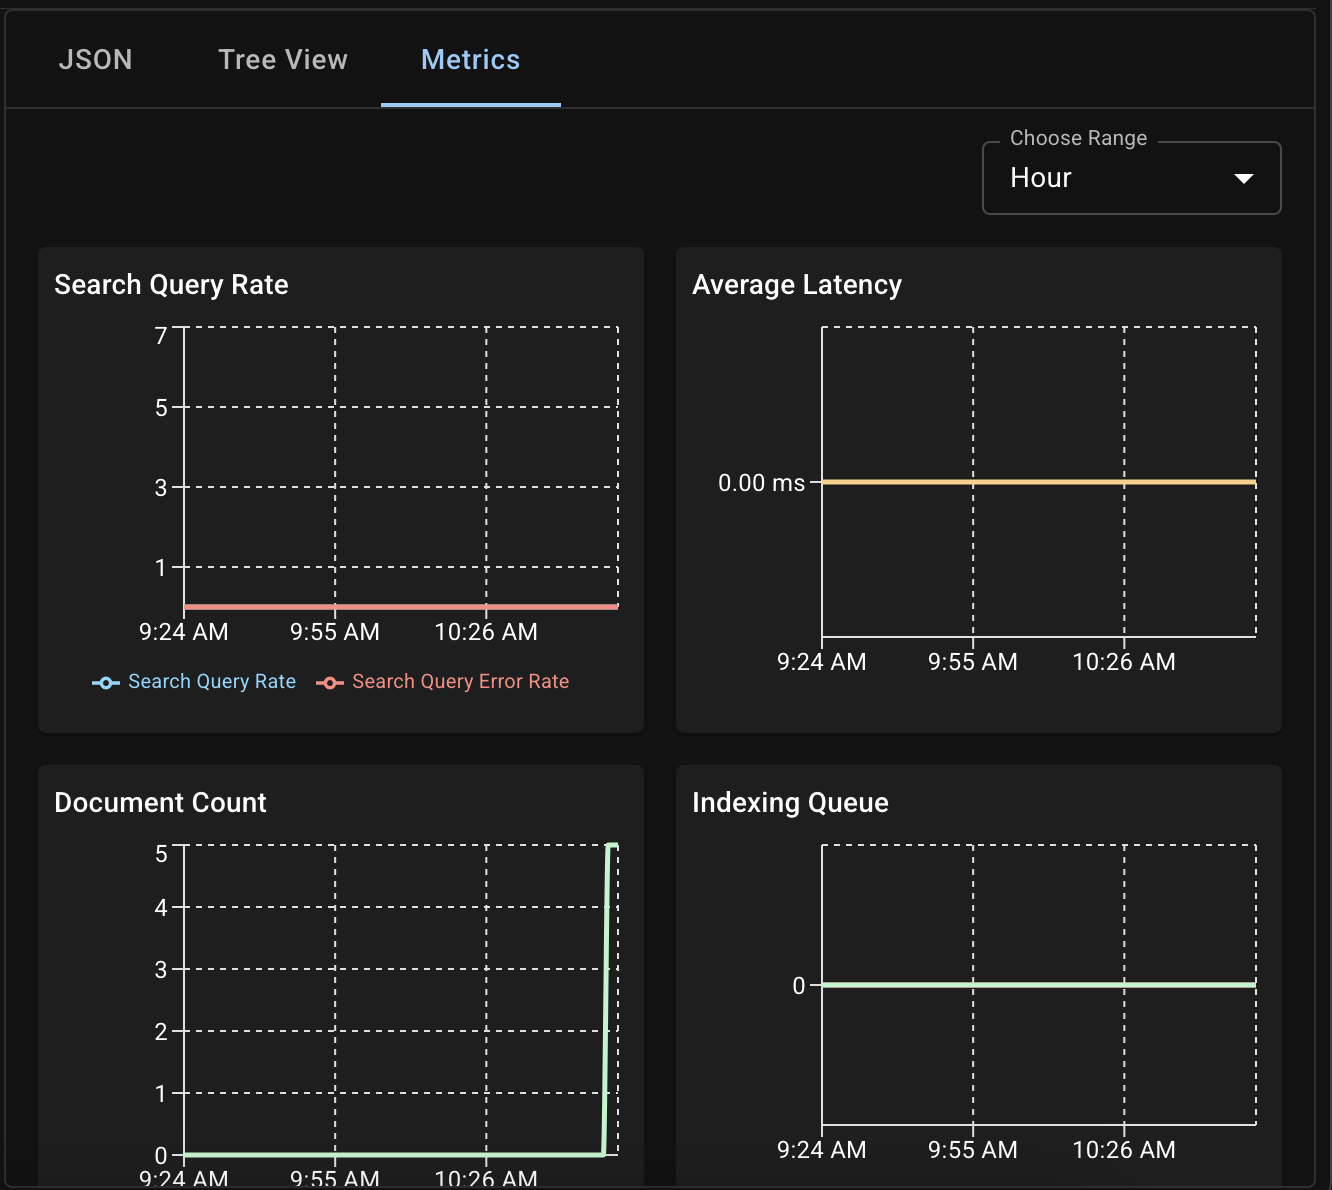
Key metrics include:
- Search Query Rate: overall search rate and error rate
- Average Latency (ms)
- Document Count indexed
- Indexing Queue: Mutations Remaining and Docs Remaining
All metrics are sourced from Couchbase Server’s FTS engine.